
Wax Management Strategy Part 1: Establishing Initial Wax Risk
Wax deposition is an issue that arises whenever an oil composition containing appreciable wax content encounters flow, temperature, and pressure that are conducive for solids formation. Wax deposition can potentially occur anywhere in the system from the reservoir to the refinery.
Wax remediation is a costly endeavor. Typical industry costs of wax in oil and gas production environments include:
Upwards of $20-25 million for a single, deep-water wax remediation operation, not including the cost associated with deferred production.
Control of wax in the Eagle Ford shale play is listed as a top Lease Operating Expense (LOE) by a majority of the operators in that area (1).
The “bottoms” removal of a 260-foot diameter refinery crude oil storage tank cost over $1.6 million in labor costs in addition to regulatory waste disposal fees; additionally, the operation took over 9 months to complete (2).
Wax management strategies developed during Front End Engineering Design (FEED) can mitigate or perhaps even prevent these costs. The goal of this GATEKEEPER series is to provide high-level insight into the planning, execution, and maintenance of wax management strategies. Each publication will step through a portion of the life cycle of a hypothetical project, from FEED to Operations. Future GATEKEEPERs will explore wax deposition modeling and development and optimization of wax mitigation strategies. The actions presented in this series are applicable to most field types and locations.
UNDERSTANDING THE PRODUCTION FLOW PATHWAY
Understanding the production flow pathway is the first step in accurately defining the inherent wax precipitation and deposition risk. For example, consider the hypothetical case outlined in Figure 1. The field layout consists of a single well tieback using a deepwater flowline-riser system under offshore operating conditions. Figure 1 shows that the well is 13,000 ft deep with a 20 mile flowline connecting the wellhead to the riser, which is at 4,500 ft water depth.

WAX CHARACTERIZATION TESTING
Next, the production fluid composition and its physical properties are evaluated in order to generate a production window. The production window will show potential wax risk locations in the production pathway.
In order to generate the production window, the hydrocarbon’s critical properties pertaining to wax deposition need to be established through wax characterization testing of downhole and stock tank oil (STO) samples. An ideal suite of wax characterization testing is as follows:
Wax Appearance Temperature (WAT)
Hydrocarbon Compositional Analysis
Wax Solubility Curve
Pour Point (PP)
Wax Content
1. WAX APPEARANCE TEMPERATURE (WAT)
WAT establishes the temperature at which wax crystals begin to form in solution making depositionpossible. Although effected by pressure, WAT is usually conducted on STO at ambient pressure, which yields conservative measurements as shown in Figure 2. The following analytical techniques are recommended to be used concurrently to determine WAT:
Cross Polarized Microscopy (CPM)
Differential Scanning Calorimetry (DSC)

CROSS-POLARIZED MICROSCOPY (CPM)
CPM usually delivers the most conservative WAT due to method sensitivity. This method also determines crystal morphology and size to characterize wax type(4) .
DIFFERENTIAL SCANNING CALORIMETRY (DSC)
Crystallization onset is determined by the appearance of an exothermic peak during the cooling process. It is critical that the cooling rate be minimized during analysis to reduce supercooling which erodes accuracy. A DSC thermogram will also yield crystallization and melting properties of deposits which can provide valuable insight into mitigation strategies.
2. HYDROCARBON COMPOSITIONAL ANALYSIS
The hydrocarbon composition is determined using High Temperature Gas Chromatography (HTGC). The analysis provides the “finger print” for the carbon chain distribution in the sample oil. Knowledge of the constituents and their mass fractions is essential to predictive wax deposition modeling.
3. WAX SOLUBILITY CURVE
The solubility of the wax in the crude oil as a function of temperature is a key parameter that must be known to predict deposition. DSC is often used to provide the key relationship. Filtration and Nuclear Magnetic Resonance (NMR) techniques can also be used. If laboratory testing is not available, empirical relationships or thermodynamic modeling software, such as PVTsim, can be used to evaluate wax solubility as a function of temperature. A recent assessment demonstrated a best practice methodology to accurately predict wax solubility as a function of temperature (5).
4. POUR POINT (PP)
Often defined as the highest temperature at which crude oil ceases to flow, the PP measurement is a crucial parameter for understanding crude oil hydraulics as a function of temperature, most notably cool-down and restart events. ASTM D97 is the generally accepted method to use to determine PP, but the manually intensive methodology is often better accomplished via automatic instrumentation.
If the risk of the pour point being reached exceeds acceptable levels, the yield stress of the crude oil should be determined in model pipelines considering project specific temperatures, cooling rates, and applied shear during cooling.
Constant-stress rheometry and expert evaluation may be needed if the yield stress of gelled crude could pose significant restart problems (6,7).
5. WAX CONTENT
Although withdrawn, UOP-46 (or a variant) is still the most common methodology cited in % wax content generation.
This parameter does not have direct use in designing a production system, although it does provide insight into the potential for wax problems.
Chemical usage will be directly proportional to the amount of wax that is present in the system.
Wax content > 10% can indicate fluid flow and restart problems.
GENERATING THE PRODUCTION WINDOW
Once wax characterization testing is complete and the critical properties are known, the production window can be generated and analyzed.
The critical properties of the hypothetical single-well tieback case are shown in Table 1. Using these critical properties, a production window can be generated for each section along the production pathway. Plotting pressure versus temperature along with the WAT will show potential risk areas for further analysis.
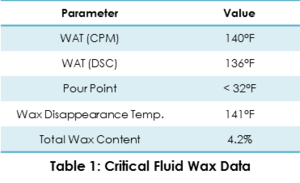
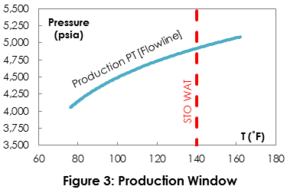
Wax deposition is a possibility in the production pathway. The hydrocarbon is going to be produced for some duration below its WAT. This is a prerequisite condition for wax deposition, although it is not a confirmation of it.
Wax deposition modeling is necessary to quantify the risk and begin the process of determining the appropriate strategies for mitigation, if necessary.
Wax gelling and cold restart should not pose a flow assurance issue for this project. The PP temperature of this crude oil is well below any temperature that will be experienced during a shut-in situation.
NEXT STEP – DETERMINING WAX DEPOSITION RISK WITH MODELING
Preliminary investigation of wax characterization testing has determined the following for the hypothetical field case:
Wax deposition is a risk for the project.
Crude oil gelling should not be a project risk.
As mentioned earlier, wax precipitation does not necessarily indicate wax deposition. The next step in the process of developing a wax management strategy is wax deposition modeling. This is the subject of the next GATEKEEPER in this series.
REFERENCES
2nd Annual Production Chemicals Optimization Unconventional Oil & Gas Conference (2016)
http://blog.fqechemicals.com/removing-heavy-organic-deposits-from-the-crude-unit
Deep Star IV Project, Flow Assurance Design Guideline DSIV CTR 4203b-1, 10-6, (2001)
Bacon, M. M., Romero-Zerón, L. B., & Chong, K. K. (2010, December 1). Determining Wax Type: Paraffin or Naphthene? Society of Petroleum Engineers. doi:10.2118/124799-PA
Assessment and Improvement of n-Paraffin Distribution Obtained by HTGC To Predict Accurately Crude Oil Cold Properties B. Coto, J. A. P. Coutinho, C. Martos, M. D. Robustillo, J. J. Espada, and José L. PeñaEnergy & Fuels 2011 25 (3), 1153-1160 DOI: 10.1021/ef101642g
Rheological Characterization of Waxy Crude Oils: Sample Preparation, Flávio H. Marchesini, Alexandra A. Alicke, Paulo R. de Souza Mendes, and Cláudio M. Ziglio, Energy & Fuels 2012 26 (5), 2566-2577 DOI: 10.1021/ef201335c
Zhang, G., Xiao, W., Liu, G., & Lan, H. (2014, June 1). The Initial Startup Wave Velocity in Isothermal Pipeline With Compressible Gelled Crude Oil. Society of Petroleum Engineers. doi:10.2118/163050-PA